The overall goal of satellite-derived products is to harness information and take perspective action. Accurate information assists us in understanding how the world changes on multiple timescales. With the satellite imagery figures, our objective at project UPSCALE is to geovisualise empirical results of biophysical and climatic conditions by deriving informative maps of East Africa, with a focus on our study countries of Kenya, Tanzania, Rwanda, Uganda and Ethiopia. To achieve this, we first focused on freely available MODIS satellite data from NASA´s Terra and Aqua satellites to derive information on drought severity, vegetation and temperature in East-Africa. This allowed us to better understand the current surface conditions and the estimated future trends in the region. Our next step is to move from the regional to the local-level perspective. Data gathering campaigns are ongoing after which we plan to derive high accuracy land cover classification maps for our study areas. Keep in mind, the process is ongoing and there will be more maps, both on a regional and local scales to come.
Soil map
The soil fertility is calculated based on the soil types provided by Soil Atlas of Africa. We catogorized the soil fertilities into 5 groups (Excellent, Excellent if slope > 2%, Good, Marginal, and poor). Reference: Dewitte, O., Jones, A., Spaargaren, O., Breuning-Madsen, H., Brossard, M., Dampha, A., Deckers, J., Gallali, T., Hallett, S., Jones, R., Kilasara, M., Le Roux, P., Micheli, E., Montanarella, L., Thiombiano, L., Van Ranst, E., Yemefack, M., Zougmore, R., 2013. Harmonisation of the soil map of Africa at the continental scale. Geoderma, 211-212, 138-153.
Fertility Excellent |
|
Fertility Excellent (if slope > 2%) |
|
Fertility Good |
|
Fertility Marginal |
|
Fertility Poor |
|
Fertility N/A |
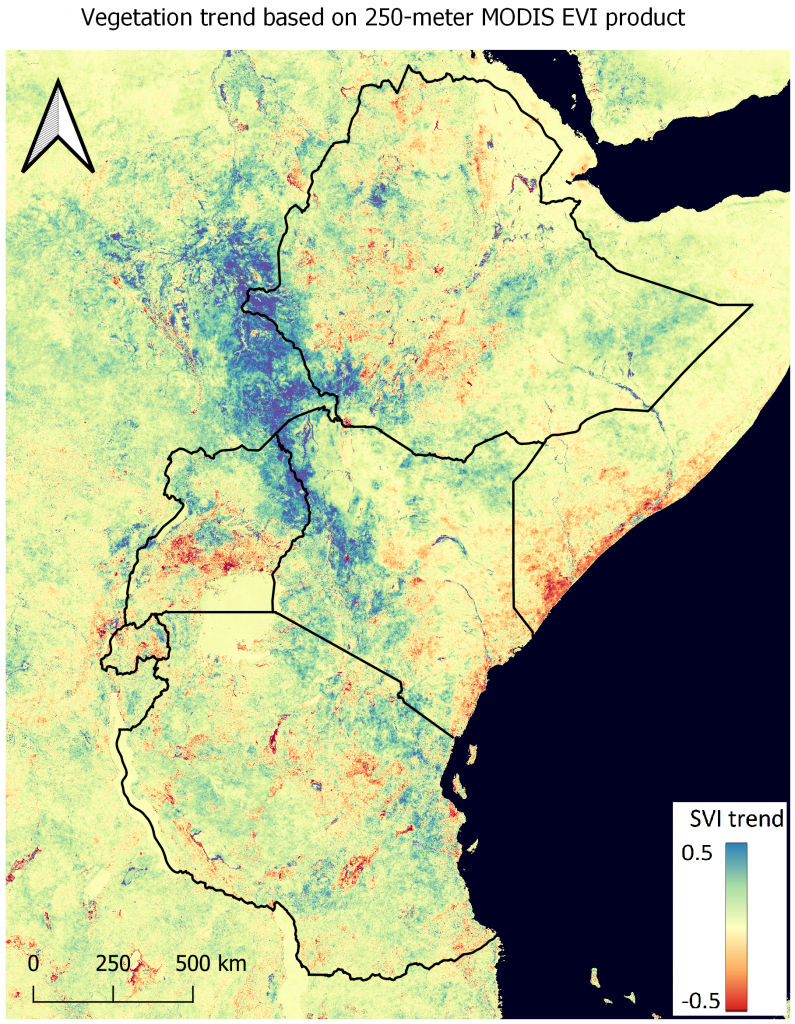
Drought Severity Map
Data source:
The figure is derived using MODIS satellite imagery spanning from 2000 to present day. It shows the long-term vegetation trend based on Standardized Vegetation Index (SVI).
Interpretation:
SVI-index describes the probability of variation from the normal vegetation values over multiple years of data on a weekly time step.
Therefore the negative values indicate a decrease in vegetation and positive values show an increase in vegetation.
More information:
https://un-spider.org
Resolution:
The resolution of the data used is 250-meters, therefore it is not suitable for field-level interpretation and should be interpreted for regional scale.
Files:
We provide here a figure which can be used for presentations.
For analysis-ready shapefile contact adomas.liepa@uni-wuerzburg.de.
Data source: Didan, K. (2015). MOD13Q1 MODIS/Terra Vegetation Indices 16-Day L3 Global 250m SIN Grid V006. NASA EOSDIS Land Processes DAAC. https://doi.org/10.5067/MODIS/MOD13Q1.006
Concept idea: Peters, A.J. & Walter-Shea, Elizabeth & Ji, Lei & Viña, A. & Hayes, Michael & Svoboda, Mark. (2002). Drought monitoring with NDVI-based Standardized Vegetation Index. Photogrammetric Engineering and Remote Sensing. 68. 71-75.
Leaf Area Index and Leaf Area Index Maps
The Leaf Area Index (LAI) can be viewed as the thickness of the vegetation cover. More strictly, it is a dimensionless quantity that characterizes plant canopy and is defined as the green leaf area per unit ground surface area. The values range from 0 to 100 indicating the procentage of green elements of the canopy per unit horizontal ground area.
The LAI maps are derived from MCD15A3H V6 level 4 dataset, using values sensed by MODIS sensors located on NASA´s Terra and Aqua satellites from within the 4-day period.
LAI.png shows the average leaf area index over the sensing period.
LAI trend.png shows the trend observed over the sensing period.
The product has a 500-meter pixel size and is derived from the period 04.07.2002 – 05.01.2022.
Useful links:
User´s Guide: https://lpdaac.usgs.gov (PDF)
Algorithm Theoretical Basis Document: https://lpdaac.usgs.gov (PDF)
General Documentation: https://ladsweb.modaps.eosdis.nasa.gov
Data source: Myneni, R., Knyazikhin, Y., Park, T. (2015). MCD15A3H MODIS/Terra+Aqua Leaf Area Index/FPAR 4-day L4 Global 500m SIN Grid V006. NASA EOSDIS Land Processes DAAC. https://doi.org/10.5067/MODIS/MCD15A3H.006
Hover/click on image
Temperature Trend Map
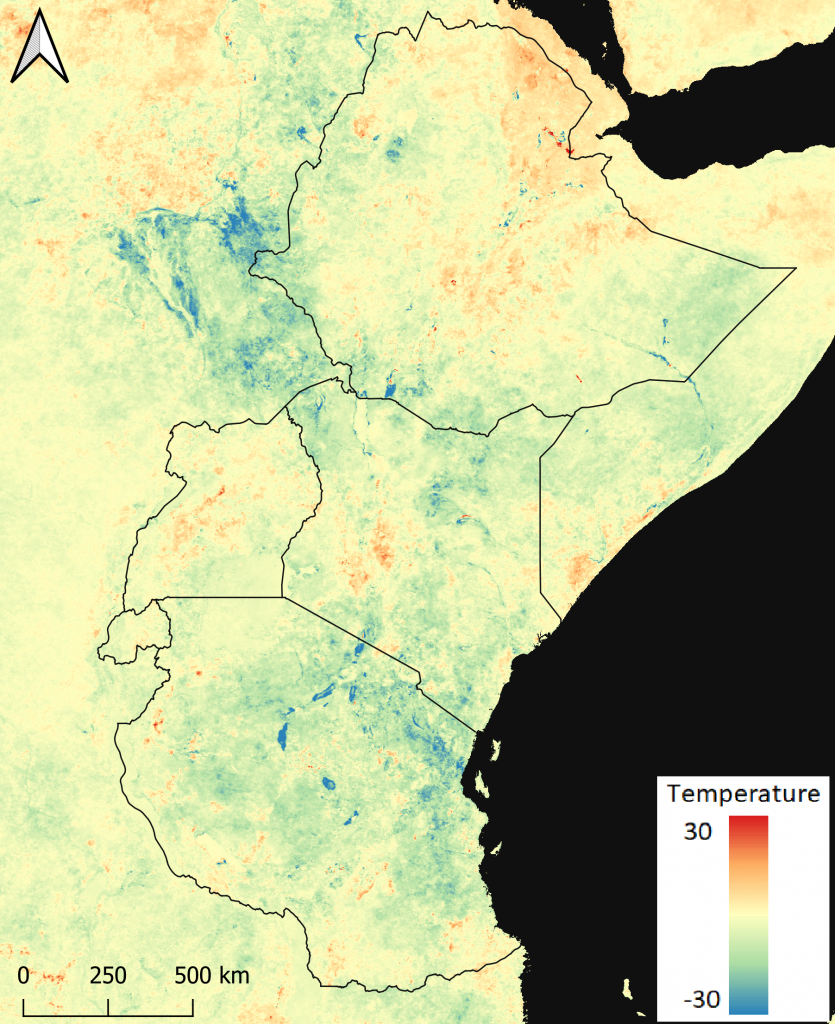
The temperature trend map is derived from MODIS 8-day land surface temperature (LST) dataset spanning between 2000 and 2022. Each pixel value is an average of the corresponding LST pixels collected within that 8-day period. The length of the period (8-days) was selected because twice that period is the exact ground track repeat period of the satellite platforms.
The values are converted to Celsius by subtracting the original Kelvin values with 273.15.
Spatial resolution is 1000 meters.
Useful links:
User´s guide: https://lpdaac.usgs.gov (PDF)
Algorithm Theoretical Basis Document: https://lpdaac.usgs.gov (PDF)
General Documentation: https://ladsweb.modaps.eosdis.nasa.gov
Data source: Wan, Z., Hook, S., Hulley, G. (2015). MOD11A2 MODIS/Terra Land Surface Temperature/Emissivity 8-Day L3 Global 1km SIN Grid V006. NASA EOSDIS Land Processes DAAC. https://doi.org/10.5067/MODIS/MOD11A2.006
